If you have been following education at all over the past few weeks, you have probably seen articles about the recently published National Report Card or NAEP scores and how the scores are way, way down. Time wrote an article calling the losses “staggering” and plenty of other reporting agrees.
There is a similar sentence in a lot of this reporting that goes something like “we knew that pandemic learning was bad, we just had no idea it would be this bad.”
So let’s talk about what the National Report Card is and what the scores mean. Get ready for some acronyms.
The National Assessment for Educational Progress (NAEP) is a test administered by the National Center for Education Statistics (NCES), a part of the Institute of Educational Sciences (IES) within the Department of Education (ED), It was administered as a trial first in 1969, but most of the data points start in 1971 or 73. This is not a test that produces results for individual students like the SAT. Instead it tries to quantify how students are doing at the district, state or national level, mostly in reading and math, although other subjects are assessed occasionally.
The NAEP scores that are in discussion here are the “Long Term Trend Assessment” scores, which is synonymous with the National Report Card. The test scores from this year fell a lot compared to previous years.
Let’s explore that through some graphs.
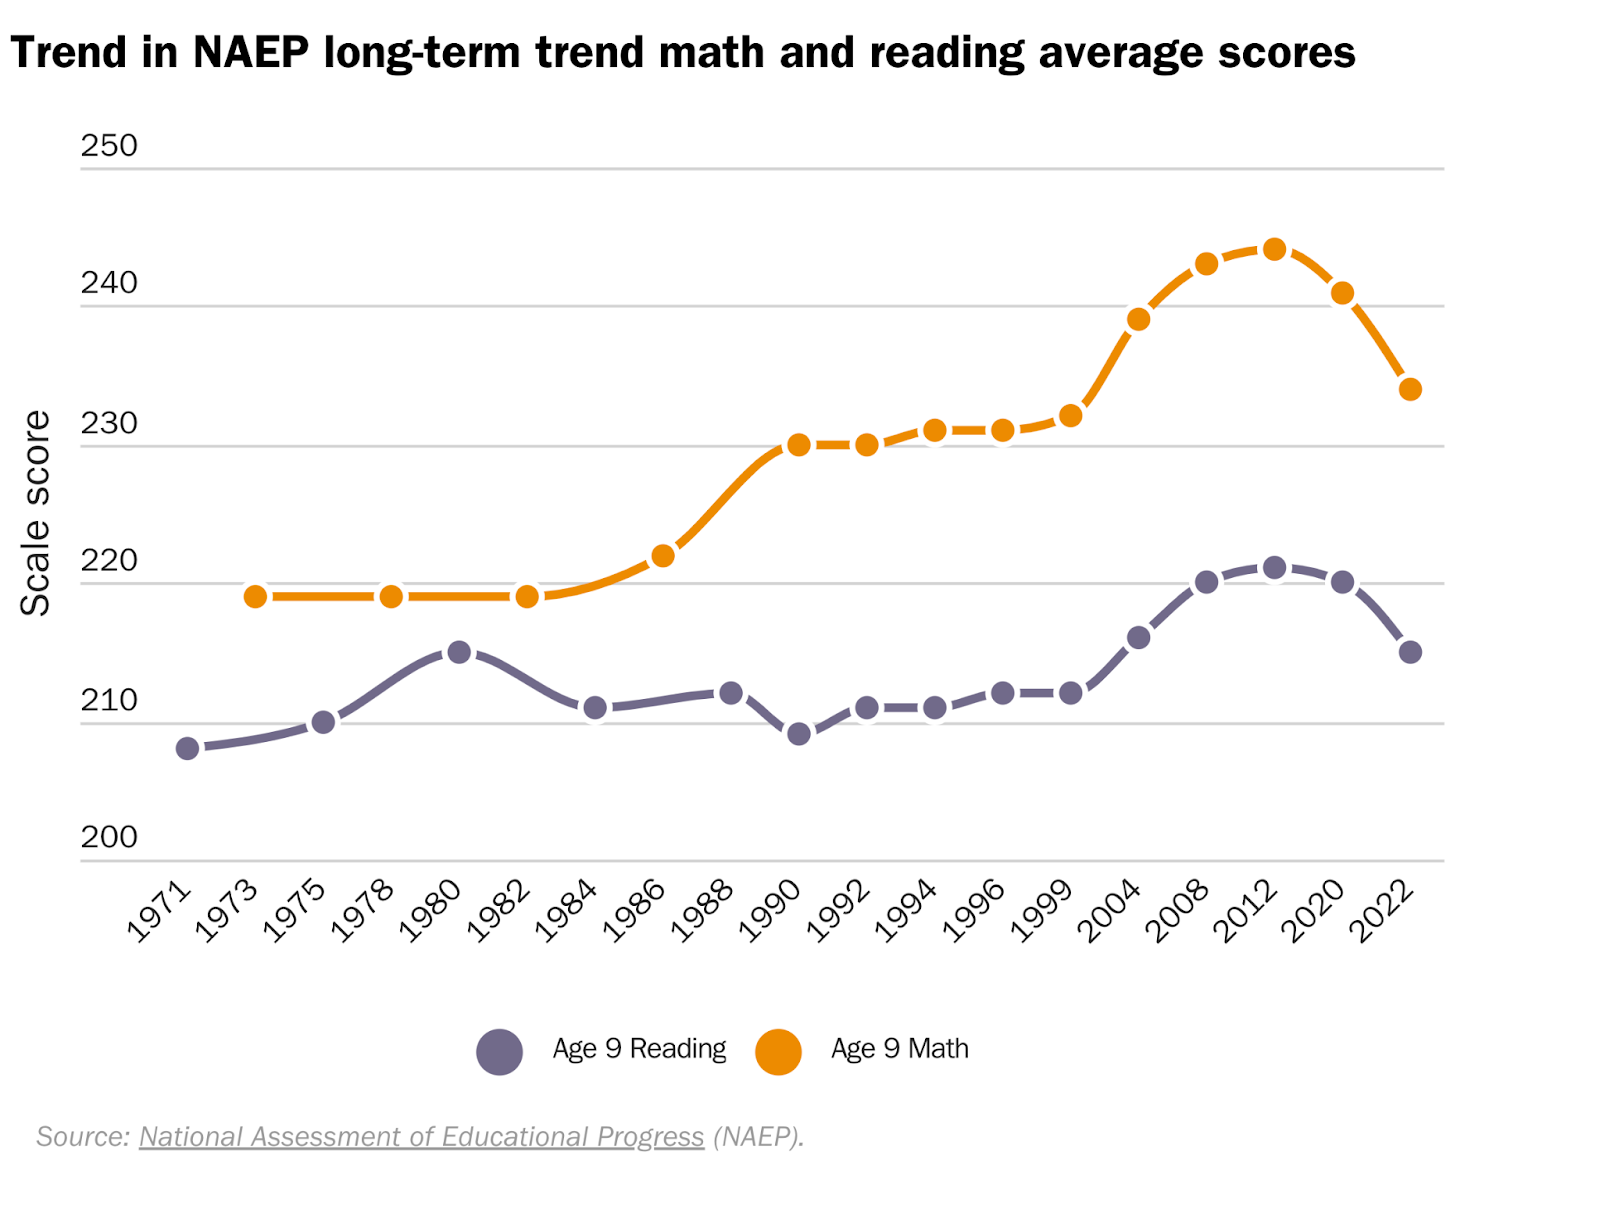
First up is a graph produced by the Libretarian think tank, the Cato institute. The Cato Institute has long been critical of school closures and lockdowns in general, so unsurprisingly they generated the most dire graph that the data would allow.
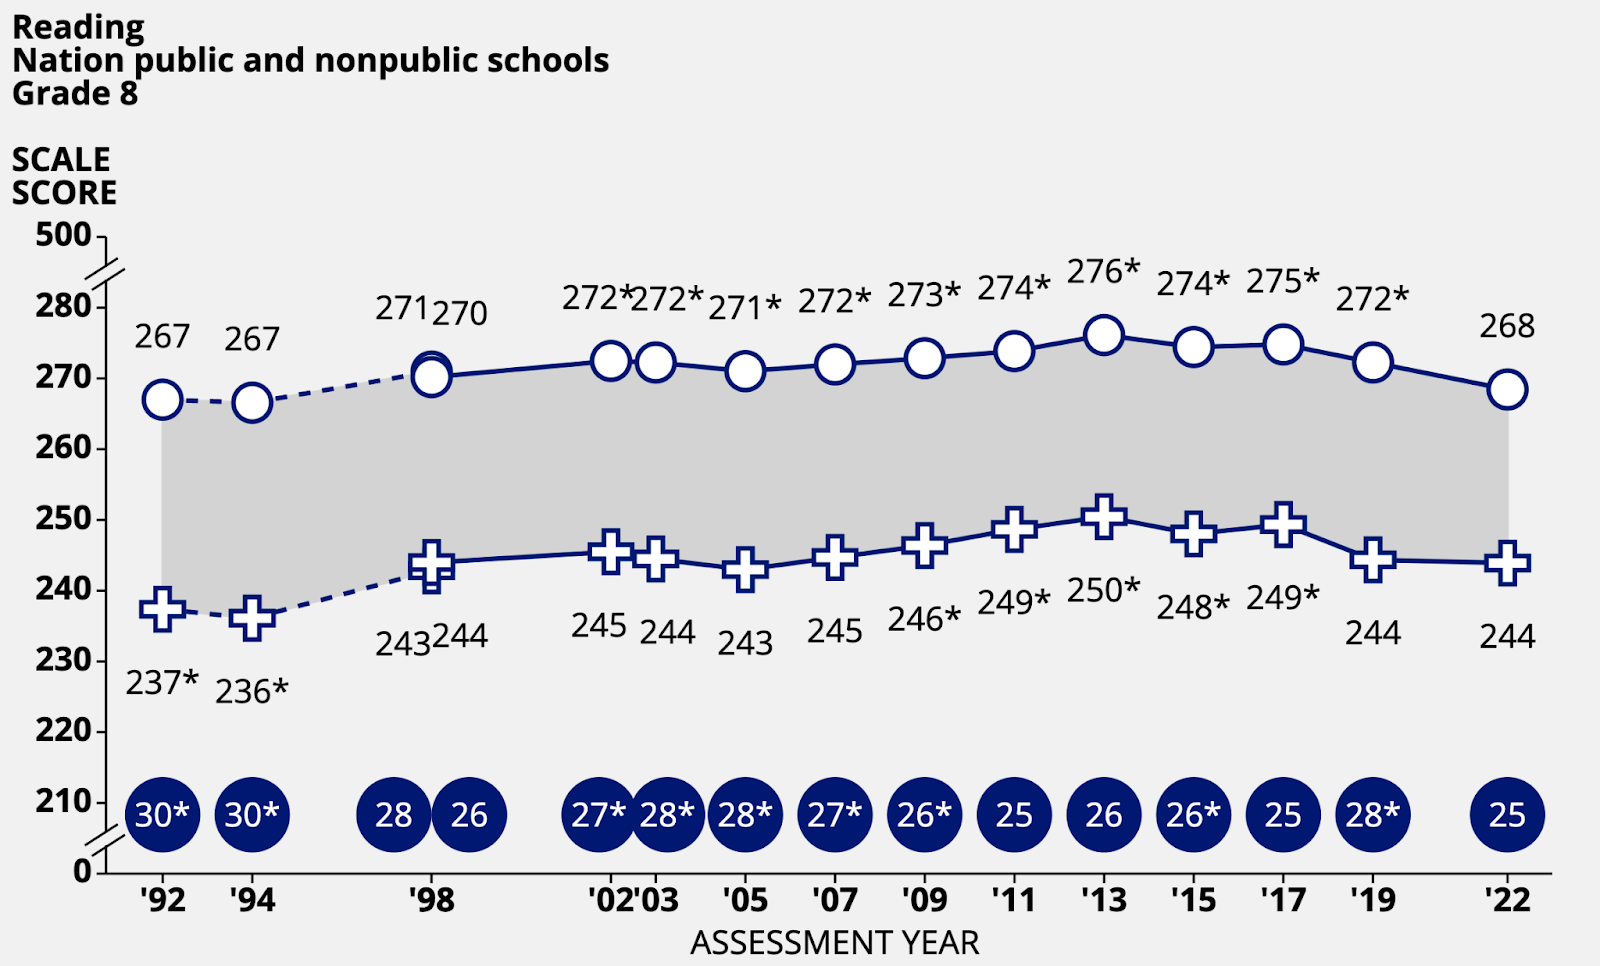
In contrast, here is the same graph from the NAEP website, an organization which is doing everything it can to publicize the score decrease.
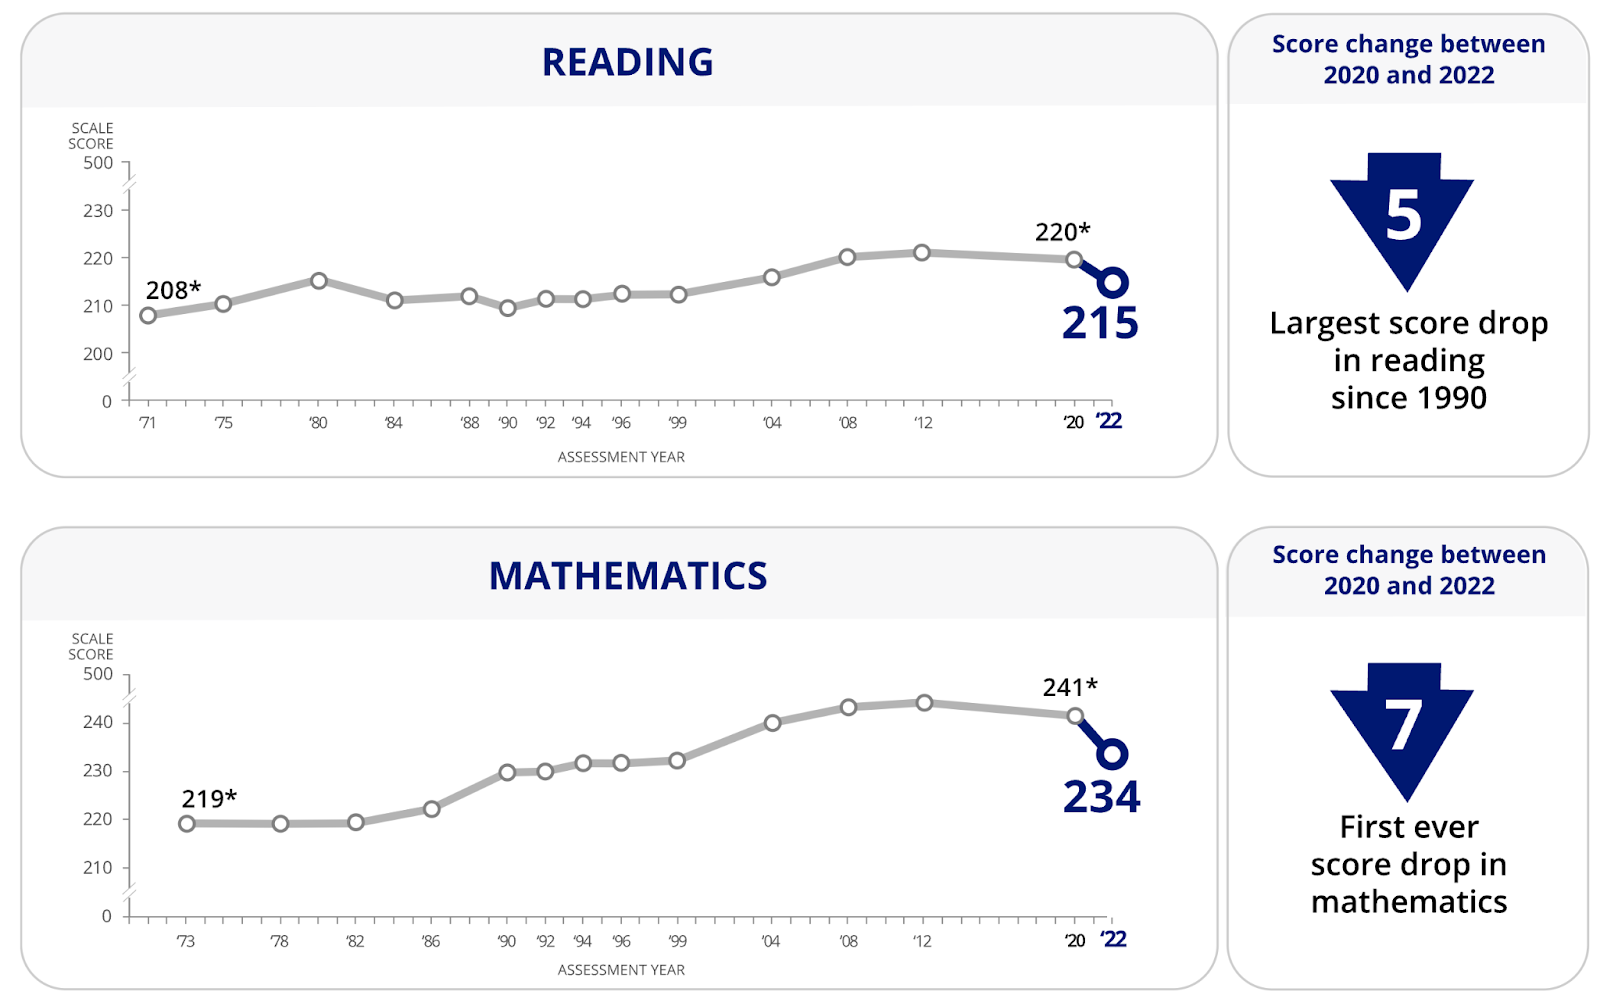
Neither graph portrays the outcome as positive, but the second one does far less X and Y axis manipulation.
So the scores in 2022 are about the same as the scores in 1999, and as a result, headlines will often write this drop as “losing 20 years of progress”. But a closer examination of this trendline shows that almost all those gains were made between 1999 and 2008, and that the scores between 2008 and 2020 were relatively flat. So it’s more like we’re losing a decade of progress after a decade of score stagnation.
If you know your educational history, this was the era of standards based education reform and the first half of No Child Left Behind (NCLB). While these two topics do have their defenders, most people in the field agree that the way it forced schools to teach to the test, punished low performers, and lacked funding, was not good for the educational system as a whole.
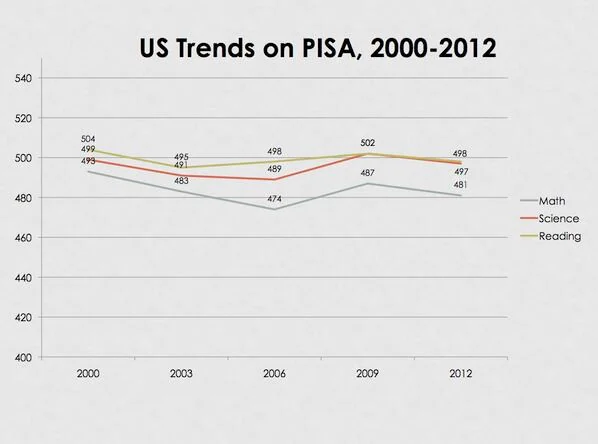
It is hard to know why the scores saw a bump in that period. Some thought that it meant NCLB actually worked. But NCLB went from 2001 to 2015 when it was replaced with the Every Student Succeeds Act, and the gains only went from 1999 to 2008. Others thought that it might be more related to teaching more test taking strategies because of NCLB, and that there is only so much score gains that can happen from that kind of learning. The fact that the Program for International Student Assessment Scores decreased over the same time makes the results even more confusing.
It is hard to know what conclusion to draw here. Either education quality in 1999 was very bad, NCLB (or other factors) made important strides to fix this but stopped working in about 2008, and then school closures during the COVID pandemic rolled back all that important work. Or the NAEP scores are an imperfect measurement, there were gains on the test between 1999 and 2008 that are’t easily attributable, and now there are some losses which are more easily attributable.
One of the biggest worries after the pandemic has been widening achievement gaps between student groups with different levels of privilege. The effects of COVID and of closures were generally felt much more by Black and Hispanic people and by lower income people so it seemed likely that they would experience a higher than average drop in scores.
But to everyone’s surprise, that didn’t happen.
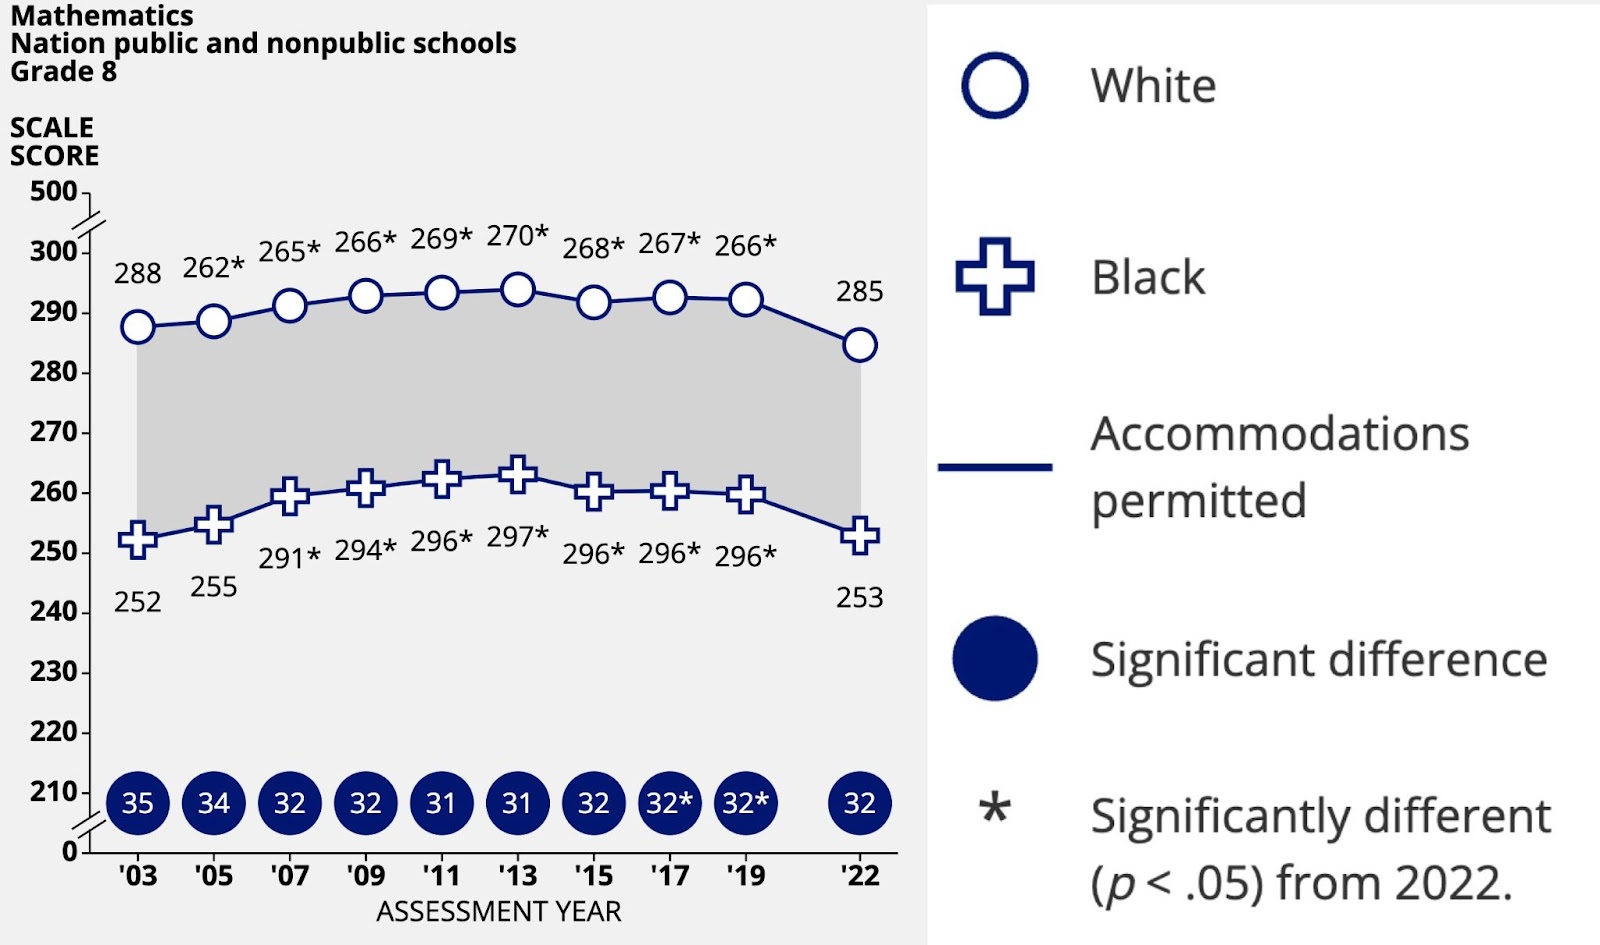
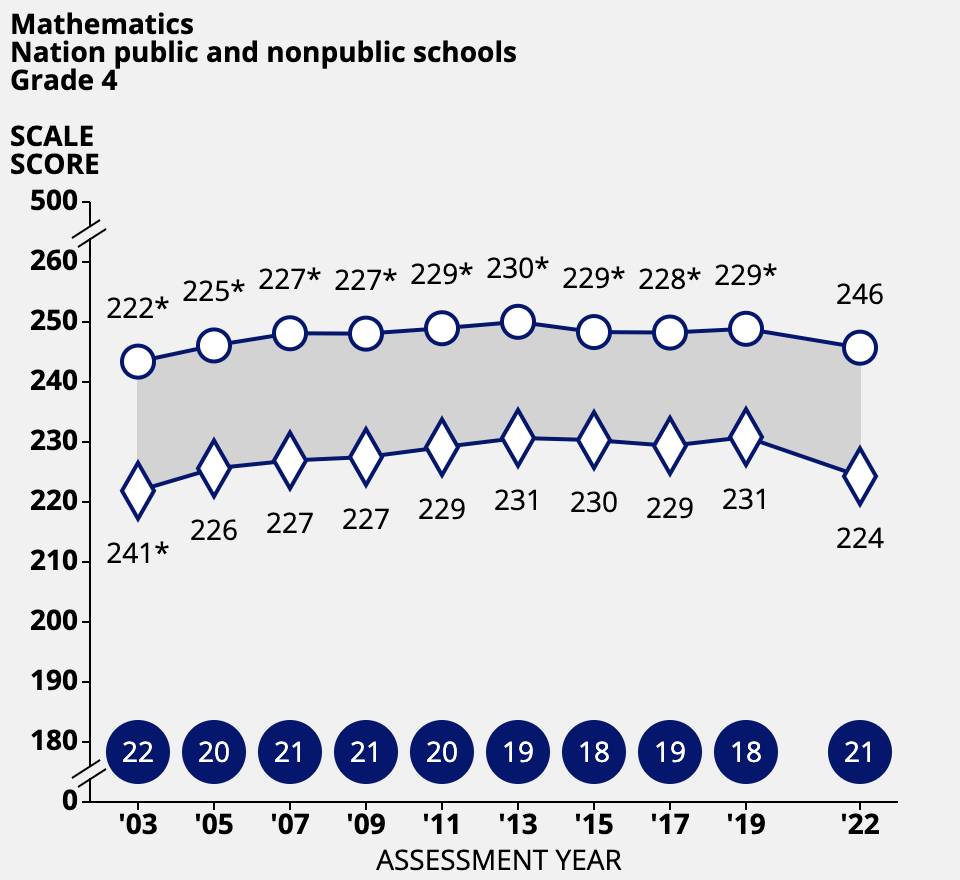
Both of these graphs can be found by playing around with the Achievement Gap section here. There are no widening achievement gaps. While black students still do not perform as well as white students, that was not exacerbated by the pandemic. This holds true across most privilege divided groups; White and Black students, White and Hispanic students, students who qualified for free lunches and those who didn’t. There was some widening for the 4th grade old scores between Black and White students in math as shown below, but it was far from the dire expectations that many educational academics had.
So what do we take away from all of this? That is not easy to know. It is unquestionable that there was learning lost, and in a really fundamental way, we as society owe those students a better education. But figuring out how to do this in a world where teachers are burnt out, administrators are burnt out, and behavioral problems are worse than ever is extra hard. Accelerated learning has hit some speed bumps, as EdSurge reported recently.
We have not seen the last of disrupted learning. Hurricane Ian closed schools in Florida and they had to go back to teaching online. Global warming will only increase the number of weather events that make it hard or impossible to gather all students in a classroom.
The NAEP scores themselves are probably not something to scare yourself over, but they really aren’t a reason to gloat about relative performance either. They are a reminder that we need to provide learning to those who lost it, and a reminder that we need to build a less fragile schooling system so that instruction can still be provided when there is another similar disruption in learning. Because figuring out how to learn when the students can’t be in the classroom is going to be very important.
Let’s all pray there is a better solution than Mark Zuckerberg’s metaverse.
Big thanks to Justin Reich for many of the insights in this article.